Concepts
The Ultimate Guide to Simplifying Amazon Analytics for Sellers & Agencies
Apr 29, 2024
by
Kajal Sharma
Understanding Amazon analytics is crucial for succeeding in the competitive Amazon marketplace. It's like having a map to guide you through the e-commerce jungle.
However, reading Amazon brand analytics on Amazon seller and vendor central dashboards is complex as Amazon provides reports in siloes.
In this post, we will show you how to simplify Amazon analytics for sellers and use the insights to move your business in the right direction. Beside sellers, this post is equally important for agencies that manage multiple accounts simultaneously, as it will make decoding Amazon reports easier.
Here’s what the blog has in store:
Section 1: Understanding Amazon Analytics and Its Importance
Section 2: Understanding the Important Aspects of Amazon Analytics
Section 3: How atom11 Helps Simplify Amazon Analytics?
Let's get started.
What Is Amazon Analytics and Why Is It Important?
Amazon analytics refers to data aggregation of advertising, vendor/seller central, and digital shelf in one place. It helps sellers and agencies understand and optimize performance at an ASIN and overall level.
Amazon analytics is important for sellers and vendors on the platform for several reasons:
It allows sellers to track Amazon sales vs. ad spend, ad performance, inventory levels, bestseller ranks, AOV, and TACoS. Hence, sellers can optimize their strategies and allocate their budgets more efficiently.
It helps sellers analyze and optimize inventory levels to prevent stockouts and reduce overall inventory costs.
It allows sellers to monitor competitors' performance, pricing strategies, customer reviews, and identify opportunities for targeted campaigns and promotions.
Sellers can gain insights into customer behavior, repeat purchases, specific keywords they use, and other keyword data to improve marketing strategies and optimize product listings.
Top 4 Insights About Amazon Analytics
1. Insights on Ad Performance
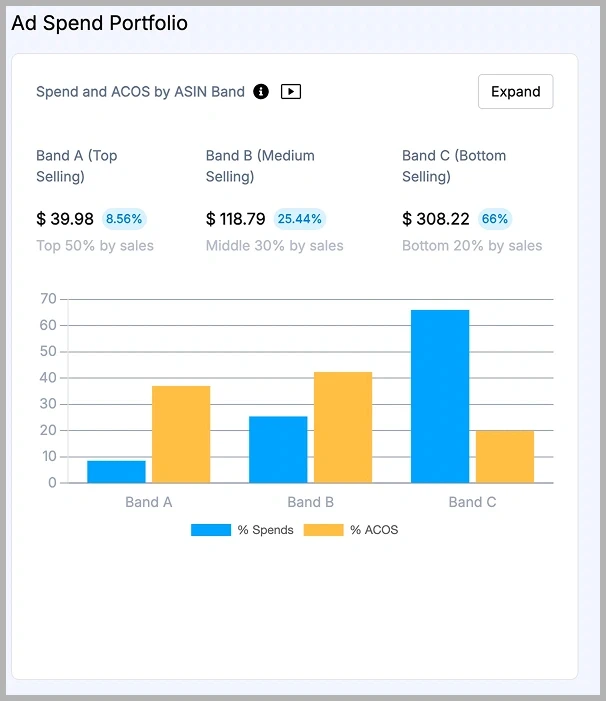
Pay-per-click (PPC) advertising is a cornerstone of Amazon's marketing strategy. It allows sellers to bid on keywords and place targeted ads. PPC analytics zooms out and shows an advertiser's ad spend profile. This is a great way to learn about areas of opportunity for improving ACoS.
The Ad Spend profile in the Amazon Analytics tool includes the following:
Spend and performance on ASIN bands
Spend and performance on campaign types
Spending and performance on placement types
Spend and performance on keyword types
2. Combining Ads and Retail Data
PPC analytics combines ad spend and total sales and shows a trend line between the two. Tools like atom11 let sellers and agencies evaluate this data at an overall level, at an ASIN level, or at a group of ASINs level.
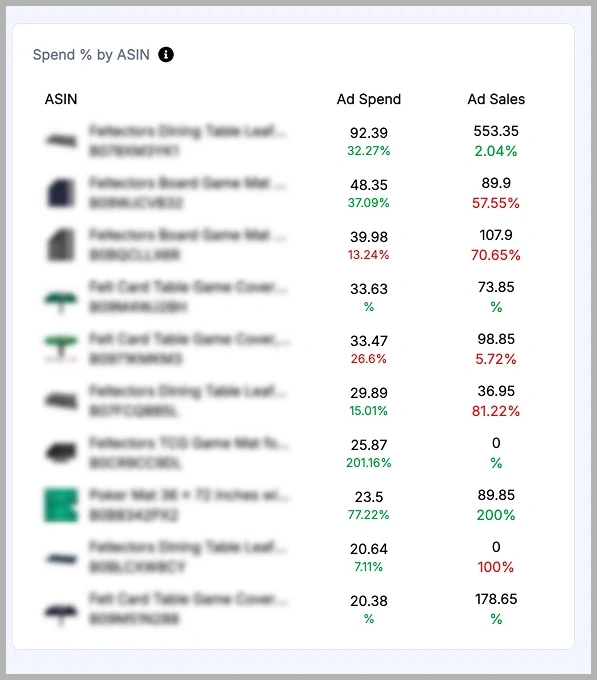
For example, atom11 combines:
AOV data with total sales and bestseller ranks
Inventory data with ad performance and total sales
Ad spend with net profit data
TACoS with ad spend and total sales
It also offers Digital Shelf to help understand competitor pricing and seller ranks.
3. Analyzing Product Performance Metrics
Monitoring product performance and sales metrics is crucial for evaluating the success of your offerings on Amazon. Metrics such as sales velocity, conversion rate, and product reviews provide invaluable insights into product demand, competitiveness, and customer satisfaction. By analyzing these metrics, sellers can refine their product strategies and enhance profit margins.
4. Optimizing Inventory Management with Predictive Analytics
Effective inventory management is a balancing act between supply and demand. Simply listing the products online without checking their level of popularity might directly and unnecessarily impact your inventory costs.
Predictive analytics tools leverage historical data and market trends to forecast demand, optimize inventory levels, and prevent stockouts or overstocking. Understanding inventory analytics can also help you take proactive advertising actions and prevent out-of-stock situations. You can read our blog on best amazon inventory management software.
How Can atom11 Simplify Amazon Analytics?
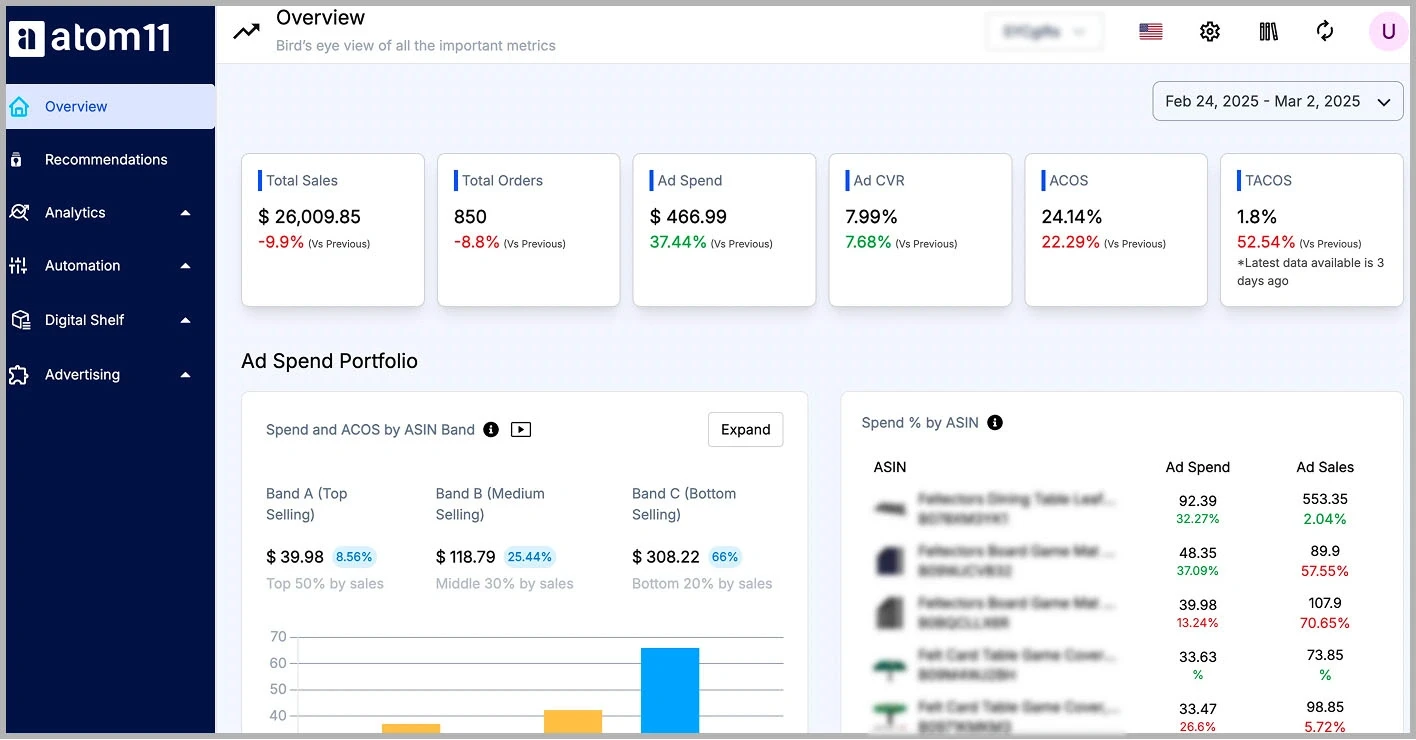
Along with being a retail aware ad automation software for Amazon sellers and agencies, atom11 hosts a strong analytics dashboard to help customers find great sales opportunities. Here are six ways in which atom11 helps you with Amazon Analytics:
PPC Ad Spend Profile
One of the best ways to find opportunities for Amazon Ad optimization is with our Zoomout strategy. This strategy lets you take a step back, analyze how you spend money, and positively impact your net margin.
With atom11, you can find your spend profile by ASIN band, campaign type, or placement type.
Sales Trend Dashboard for Time Series Analytics
With atom11, you can combine retail signals, ads, and digital shelves in one dashboard. This helps you analyze sales trends on a daily, weekly, or monthly level. You can choose which ASINs you want to analyze and do it in a single click without having to download multiple reports.

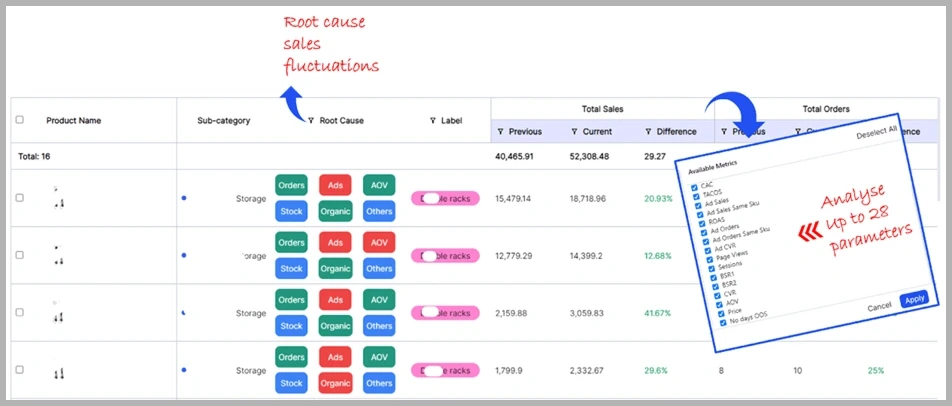
Root Cause Analytics
While comparing two different time periods for analytics, atom11 provides a root cause analyzer, which tells you what could have caused sales fluctuations between the two periods.
For example, in the image below, the orders in red mean ASINs that lost sales.
Anything that is reduced in absolute value is denoted as red, and anything that increases in absolute value is denoted in green. In this case, you can see ASINs that lost orders compared to a previous period.
Next to orders, there are parameters that impact orders, such as Ad spend, ad performance, Average Order Value (AOV), organic page views, in-stock percentage, etc. With a simple view, the root cause analyzer tells you which parameters increased/decreased, impacting lost orders.
Digital Shelf
Track your organic and sponsored keyword rank on page 1 with atom11’s digital shelf dashboard. You can use this data for tracking purposes and automating your search rank vs. account bids.
Power BI/ Looker Integrations
Everyone has their own way of looking at data. That’s why Power BI and Looker integrations come in handy. With atom11, we can set up your Looker integrations in seconds and display data the way you want. This also helps automate reporting for some agencies, as they can set up reports on refreshable Google Sheets.
Alerts
Data analysis is a mitigative activity. Sellers/agencies must aggregate data from multiple reports to find reasons for sales fluctuations. But what if there were alerts to tell you exactly what to analyze? With atom11, you can set up alerts for almost anything.
Here are a few examples:
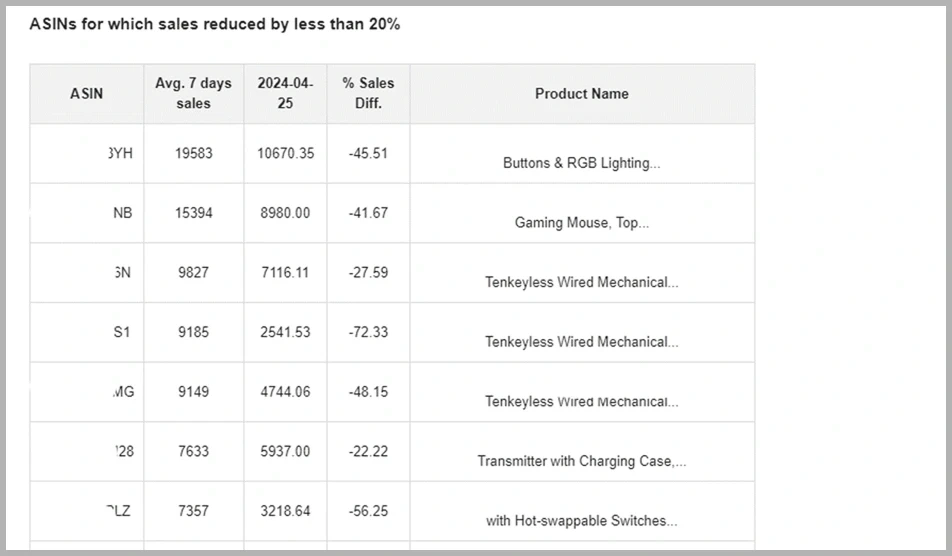
Sales Fluctuation Alerts: Find which ASINs gained/lost sales. This daily report is emailed to you every morning, telling you exactly which ASINs to focus on and determining reasons for growth/decline.
Category Change Alerts: Amazon is known to make inadvertent changes to product subcategories. This leads to a decline in organic sales and a drop in ad performance and search ranks. However, sub-category changes are hard to spot, especially if you have many ASINs. With category change alerts, you can get a daily report on any inadvertent changes on your ASIN noding/sub-cats daily.
Stock Alert: You can set up stock alerts if ASIN DOH or the number of units falls below a specific threshold.
Buy Box Alerts: If you have a digital shelf subscription with atom11, you can also set up alerts about lost buy-box.
Competitor Pricing Alerts: If you track competitors with atom11, you can receive alerts when they change pricing.
Conclusion
At atom 11, we believe that continuous optimization is the key to sustainable success on Amazon. Whether refining PPC campaigns, updating product listings, or adapting to market trends, ongoing optimization is critical for staying ahead.
By embracing a data-driven approach, sellers can iterate, refine, and grow their Amazon business over time. This also involves thorough brand-specific optimization. It always pays to stay informed about how you should plan your marketing efforts based on your niche, competitors, and market demand. This level of thorough optimization almost always pays off through increased sales, visibility, and market share.
atom11 helps you save time downloading and analyzing multiple reports. For the first time ever, you can combine retail data with advertising and run more efficient ads. Everything from thorough data analytics, providing valuable insights into the root causes of sales fluctuations in real time, competitor analysis, to optimizing and automating ads, and helping with effective product listing, atom 11 has got you covered! You can book a demo to learn more.
FAQs
Does Amazon have an analytics tool?
The Amazon analytics tool includes Amazon Business Analytics and brand analytics for brand-registered sellers. These tools help sellers gain insights into customer behavior, sales data, and other performance metrics that help optimize campaign strategies.
How do I see how much an Amazon seller makes?
Amazon Seller Central provides insights into sales, costs, and other metrics, allowing you to track performance and trends. You can also use tools like atom11 to gain detailed insights into sales and revenue.
How to look at Amazon analytics?
To view Amazon analytics, follow these steps:
Log in to your Seller Central account.
Navigate to "Reports" or "Analytics" section in the main menu.
Under analytics, you can find sales and profits dashboards, inventory reports, and business reports with customizable date ranges and metrics.